WHAT KML UNDERSTANDS
The operating system.
How the business creates value, where work flows, where control matters and which relationships explain performance.
KML designs executive intelligence systems that connect fragmented operational data to clarity, performance insight and better decisions — across hospitality, real estate and complex business operations.
KML combines operating knowledge, analytical structure and executive design to turn fragmented information into a decision environment. The dashboard is only the visible interface.
How the business creates value, where work flows, where control matters and which relationships explain performance.
Data structure, KPI relationships, management hierarchy and the analytical path from signal to action.
A coherent management environment designed around attention, accountability and the next decision.
What does management need to understand today that the current reporting environment still cannot explain clearly?
KML is designed to change the quality of management visibility: from receiving isolated numbers to understanding relationships, responsibility and the next action. The goal is not to make reporting look more sophisticated. It is to make management interpretation faster and more coherent.
Map how the operation creates value, how work moves, where revenue is generated and where control can be lost.
Connect sources, clean inconsistencies and model relationships so performance has one coherent analytical language.
Separate meaningful performance signals from reporting noise — targets, gaps, patterns, drivers and accountability.
Build the executive layer around what leadership needs to understand, challenge and act on next.
These principles keep the system coherent as more departments, data sources and management layers are added. They are the reason KML can expand without turning into a collection of disconnected dashboards.
Understand the operating model before deciding what the data should say.
More records do not create intelligence unless the relationships between them are modeled correctly.
Executive attention is limited. The important signal must appear before supporting detail.
Information is designed around responsibility, not around a generic dashboard consumer.
Visual language, definitions and KPI logic must remain consistent across departments.
The interface succeeds when it helps management act, not when it simply looks impressive.
The architecture is a chain of meaning: business activity creates data, data becomes performance logic, performance logic is assigned to the right management level, and only then is the interface designed.
In the Araz environment, this logic sits on top of real hotel operations, PMS data and more than ten operational modules. Value comes from connecting those sources into one management language rather than presenting them separately.
Rooms, F&B, sales, purchasing, inventory, finance and control generate different operational events and management questions.
PMS and operational modules provide the raw information. Source structure is understood before analytical assumptions are made.
Data is cleaned, standardized and related so different departments can be compared through one consistent analytical language.
KPIs, targets, trends, gaps and business drivers are modeled around the way performance is actually created and controlled.
Executive, commercial, operational and control responsibilities receive the depth of information appropriate to their decisions.
The final dashboard layer is designed around attention, interpretation and action — not around the maximum number of visuals.
Architecture is the discipline of deciding what must connect before deciding what must be displayed.
The principles above matter only if they survive real operating complexity. Araz is where the KML method becomes a working management system.
Araz imagery is used as operating context for the case study. KML’s focus remains the intelligence architecture, decision structure and management system behind the operation.
Araz is the clearest expression of the KML method: a large-scale five-star resort operation translated into an interconnected management intelligence environment. With more than 475 rooms, eight café-restaurants, approximately 110,000 m² of built area and 30 floors, the analytical challenge extends far beyond visual reporting. The chapters below are not isolated dashboard concepts; they belong to one operating system.
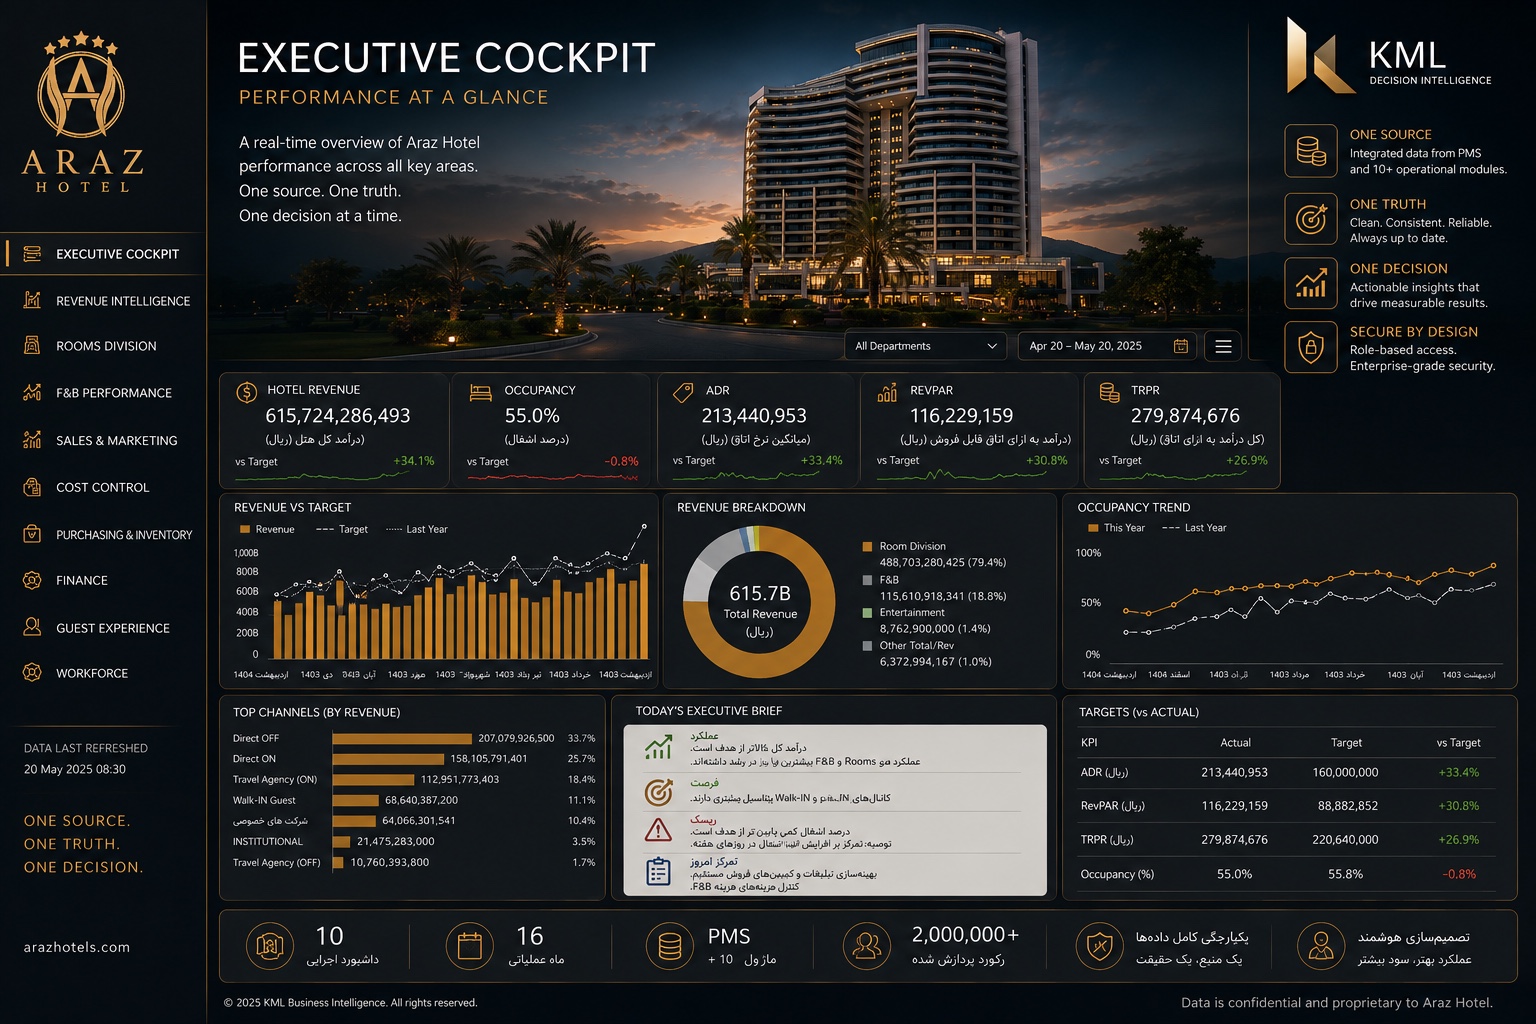
Cross-functional management view connecting the hotel’s major operating and commercial signals.
Unify management attention across the operation so leadership sees the same performance language.
A condensed cross-functional view of the hotel’s most important performance signals, designed to direct leadership attention before detail.
VISIBLE INTELLIGENCE LAYERExecutive priorities with the departmental and commercial realities that explain the headline result.
ANALYTICAL RELATIONSHIP LAYERWhere leadership should investigate, challenge ownership or intervene across the operation.
EXECUTIVE → SIGNAL → OWNER → ACTION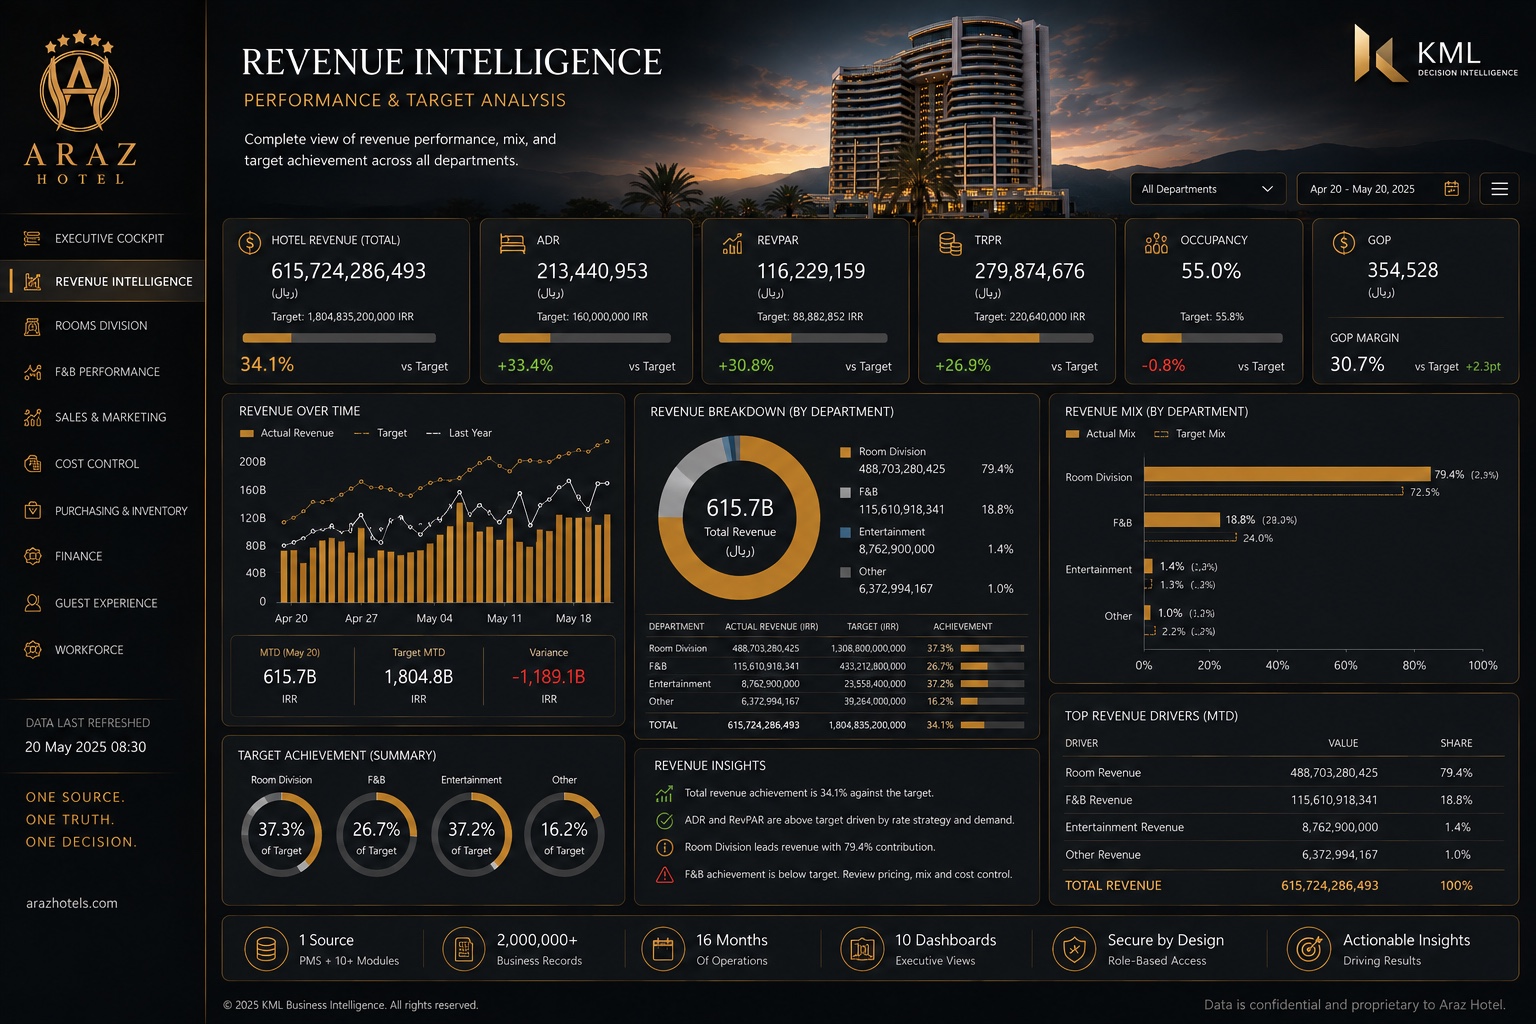
Revenue, target and contribution logic structured to explain performance — not only report it.
Explain why revenue moved, where the gap sits and which driver management should challenge next.
Revenue performance, targets, contribution and movement arranged to make the commercial result interpretable rather than simply visible.
VISIBLE INTELLIGENCE LAYERHeadline revenue outcomes with the business drivers, comparisons and operating context that influence them.
ANALYTICAL RELATIONSHIP LAYERWhich revenue gap matters, what is driving it and where commercial attention should move next.
REVENUE → DRIVER → GAP → RESPONSE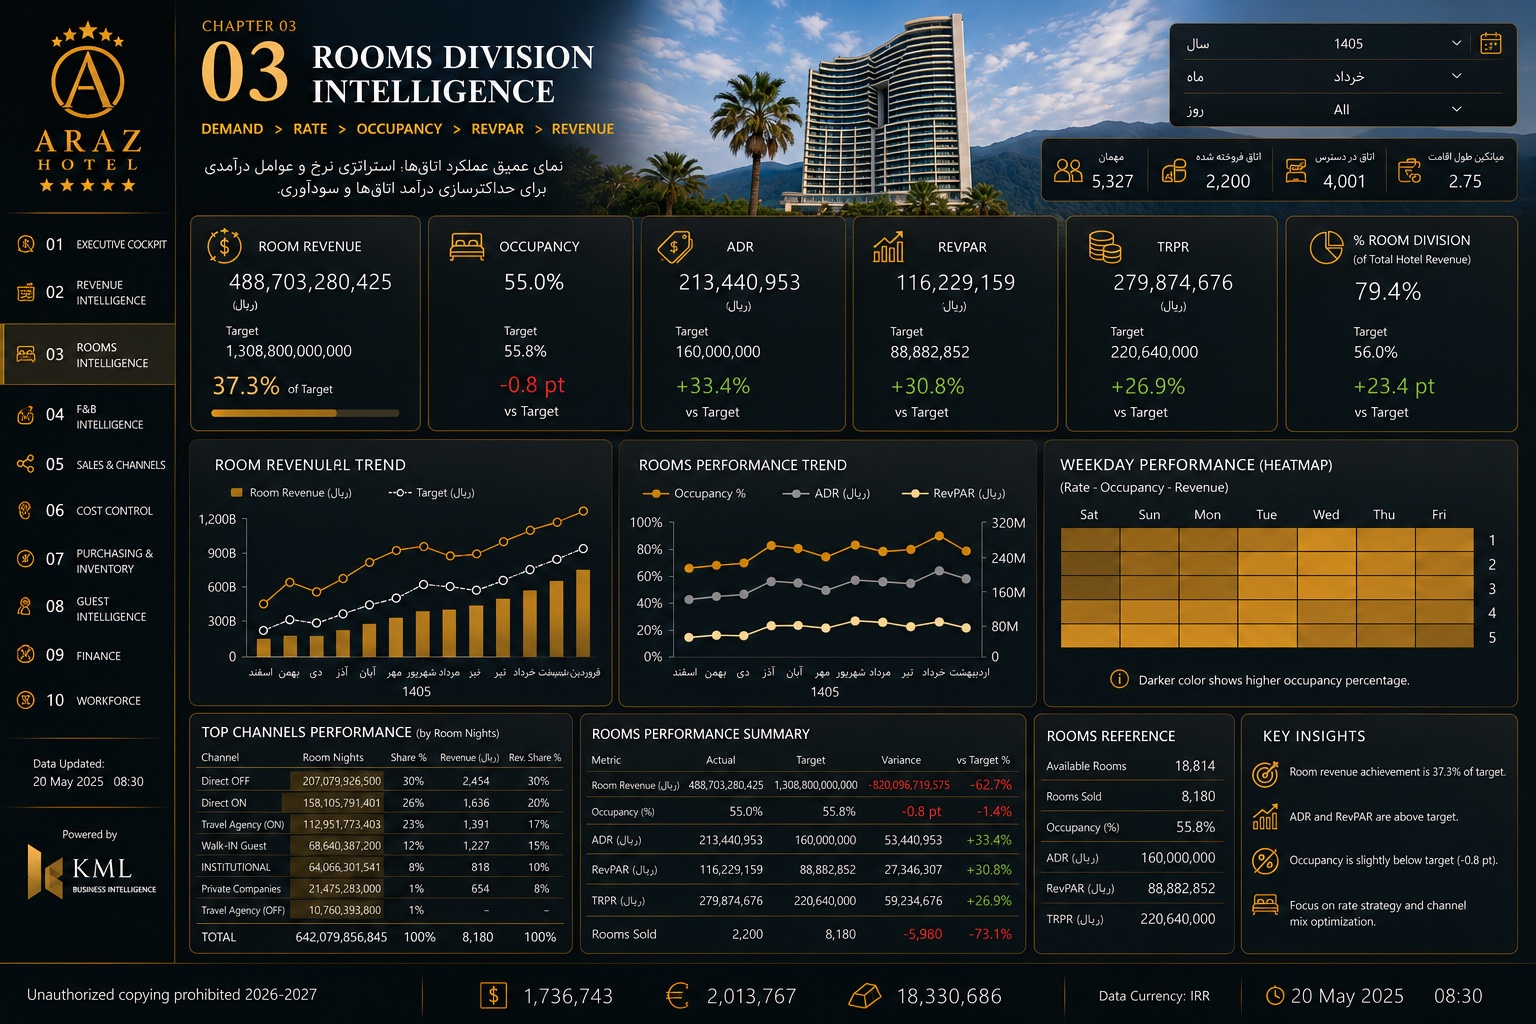
Rooms economics, demand and operating performance translated into a management layer.
Connect demand, rooms economics and operating performance into a management-ready view.
Rooms performance in a structure that connects demand, room economics and operating performance.
VISIBLE INTELLIGENCE LAYERAccommodation performance with the operating and commercial relationships behind room results.
ANALYTICAL RELATIONSHIP LAYERWhere rooms performance is strengthening or weakening and which factor deserves management attention.
DEMAND → ROOMS → PERFORMANCE → ACTION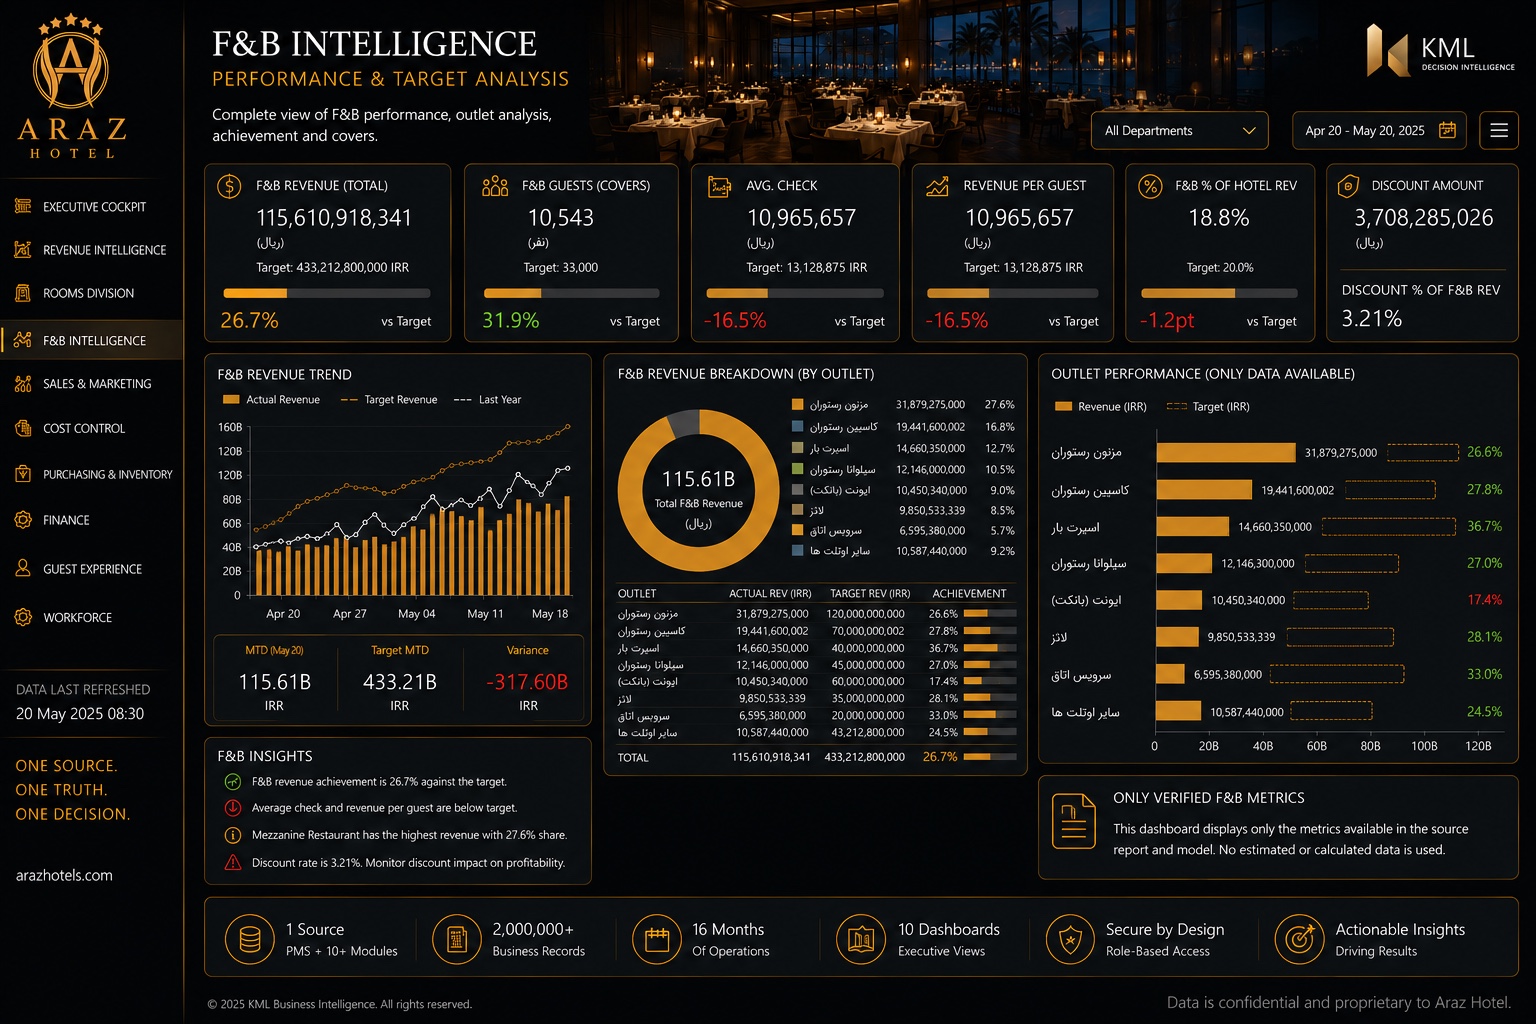
Outlet, guest and target performance connected to the commercial reality of hotel F&B.
Translate outlet performance, guest behavior and targets into commercial and operational decisions.
Food & Beverage performance through outlet, target and guest-facing commercial signals rather than isolated sales totals.
VISIBLE INTELLIGENCE LAYEROutlet performance with operational execution, guest behavior and the contribution of F&B to the wider hotel system.
ANALYTICAL RELATIONSHIP LAYERWhich outlet or performance relationship needs attention and whether the issue is commercial, operational or control-related.
OUTLET → PERFORMANCE → DRIVER → DECISIONThe approved dashboard image remains untouched. Open Decision Anatomy under any chapter to see the management logic behind the interface: what is visible, what the analytical system connects and what decision the view is designed to support.
A resort of this scale produces different operational realities at the same time: accommodation, food & beverage, commercial performance, purchasing, inventory, finance and management control. The analytical challenge is to connect those realities without losing their individual meaning.
KML approaches Araz as an operating architecture first and a reporting environment second.
475+ rooms, eight café-restaurants, 30 floors and approximately 110,000 m² of built area create a large operating footprint.
PHYSICAL COMPLEXITYDepartments do not operate in isolation. Revenue, service delivery, purchasing, cost and control influence one another.
BUSINESS COMPLEXITYMore than two million records across sixteen months and multiple operational modules must be transformed into consistent analytical logic.
INFORMATION COMPLEXITYExecutive and departmental views are structured around hierarchy, relationships, targets and the questions each management level must answer.
KML ARCHITECTUREThe objective is not visualization. It is faster recognition of performance gaps, stronger control and clearer management intervention.
DECISION LAYERExecutive KPIs, trends, targets, departmental performance and analytical comparisons presented through a consistent visual hierarchy.
A connected understanding of how the hotel operates, how performance is generated and how information should move toward management decisions.
The Araz environment is not designed for one user or one department. It supports different levels of management across the hotel — each with a different decision responsibility, but all connected to the same operating truth.
High-level visibility for leadership roles responsible for overall performance, priorities and intervention.
Commercial views focused on demand, contribution, sales performance and revenue-related decisions.
Operational intelligence focused on how hotel departments perform and where execution needs attention.
Management layers focused on financial control, cost visibility and the operational disciplines behind performance.
Information hierarchy should follow management hierarchy. The owner should not need the same level of detail as a departmental manager, and a departmental manager should not be limited to an executive summary. KML structures one analytical system with the right depth for each decision owner.
One analytical foundation across management levels.
Different information depth for different responsibilities.
Departmental performance remains connected to executive context.
Insight is tied to the person who can act on it.
Case-study figures and operating facts shown on this site are limited to information confirmed for the Araz project. Unverified claims and speculative KPIs are intentionally excluded.
Araz operates at resort scale: more than 475 rooms, eight café-restaurants, 30 floors and approximately 110,000 m² of built area.
The analytical environment is built on more than two million business records covering sixteen months of hotel operations.
PMS data and more than ten operational modules feed a broader management environment rather than a single isolated report.
The intelligence environment supports executive, commercial, operational, finance and control responsibilities across roles including Owner, CEO, General Manager and departmental management.
The approved Executive Cockpit, Revenue Intelligence, Rooms Division Intelligence and F&B Intelligence chapters demonstrate how one visual and analytical language is applied to different management questions.
A management system should not end when a KPI becomes visible. KML follows the signal further: what changed, what explains it, who owns it and what question should be asked next.
This creates continuity between analysis and management behavior without pretending that a dashboard can make the decision by itself.
A relevant change, gap, pattern or exception becomes visible inside the performance system.
The signal is read against targets, trends, related performance and the operating environment that gives it meaning.
The analytical structure helps management move beyond the headline result toward the relationships that may explain it.
The issue is connected to the management responsibility capable of investigating, controlling or changing the outcome.
The interface frames the next useful question rather than ending with a passive observation.
Management decides the intervention, follow-up or deeper investigation required by the business context.
The statement may be correct, but management is still left to discover the context, ownership and next question on its own.
The interface becomes part of a management process: not an automated answer, but a structured path toward a better decision.
The dashboard should never pretend to replace management judgment. Its job is to make that judgment better informed, faster and more accountable.
A KML system is built through business understanding, process mapping, analytical modeling and management logic before visual design begins.
This is what separates an intelligence environment from a collection of charts.
Understand how the business creates value, where responsibilities sit and which processes influence performance.
Identify sources, inconsistencies, manual workflows, missing relationships and the actual quality of the information layer.
Define the KPI relationships, targets, comparisons and drivers that describe the business correctly.
Separate executive signals from departmental detail and assign the right level of information to the right decision owner.
Design the interface around attention, hierarchy and action so the important signal is visible before the detail.
Because KML’s advantage is not generic BI knowledge. It is the ability to read the operating and commercial systems behind the numbers in industries where that experience already exists.
The analytical model becomes stronger when the business language is understood before the data is modeled.
Rooms, F&B, rate strategy, purchasing, cost, finance and guest-facing operations are analytically connected. Measuring one area without understanding its relationship to the others creates partial intelligence.
Lead source, geography, project, agent behavior, stage progression and conversion must be read together to explain why sales performance changes.
Assess the operating model, reports, KPI logic, data sources and decision blind spots before redesigning anything.
Design the data model, analytical logic and executive hierarchy as one coherent decision environment.
Use the intelligence layer to diagnose performance, challenge assumptions and focus management action.
KML was shaped through hands-on work across retail, real estate and five-star hospitality — not from a software-only background. That operating exposure informs how performance systems are designed and which questions are asked before a dashboard is built.
An architectural education adds another layer to the method: structure before decoration, hierarchy before detail, proportion before density, and clarity before complexity.
If management is receiving more reports but still needs too much time to understand what changed, why it changed and where to act, the problem is no longer visualization. It is decision architecture.
Share the operating context, the decision problem and the current reporting gap. The first conversation is about understanding the business — not selling a dashboard.